Hear Me Out
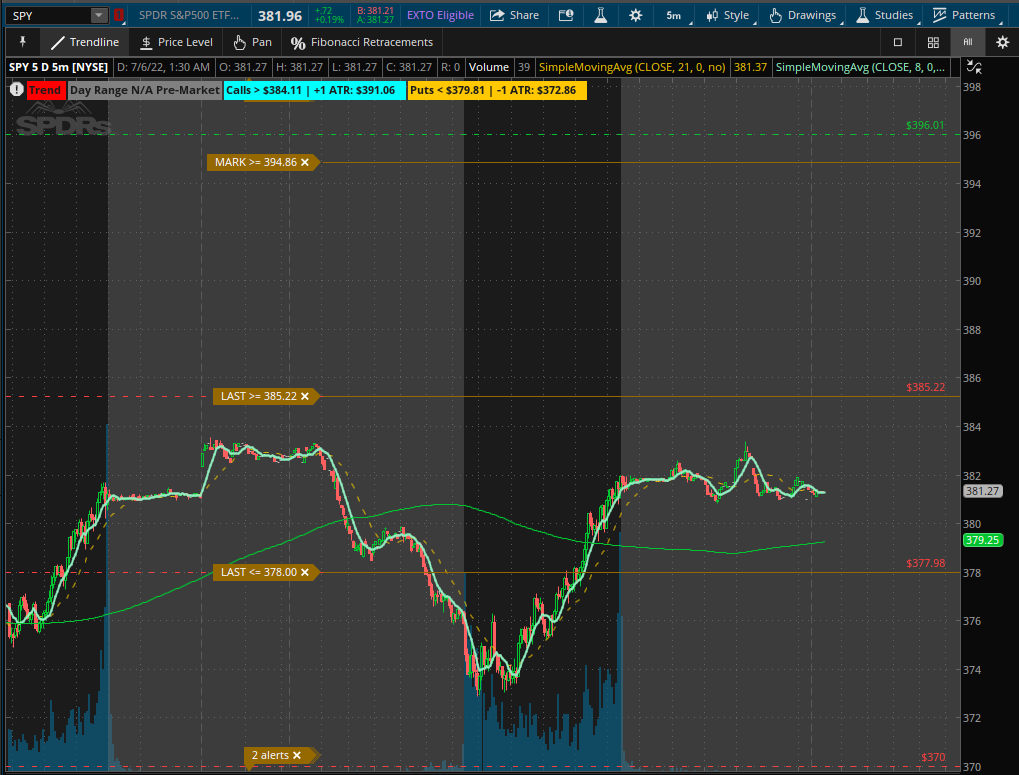
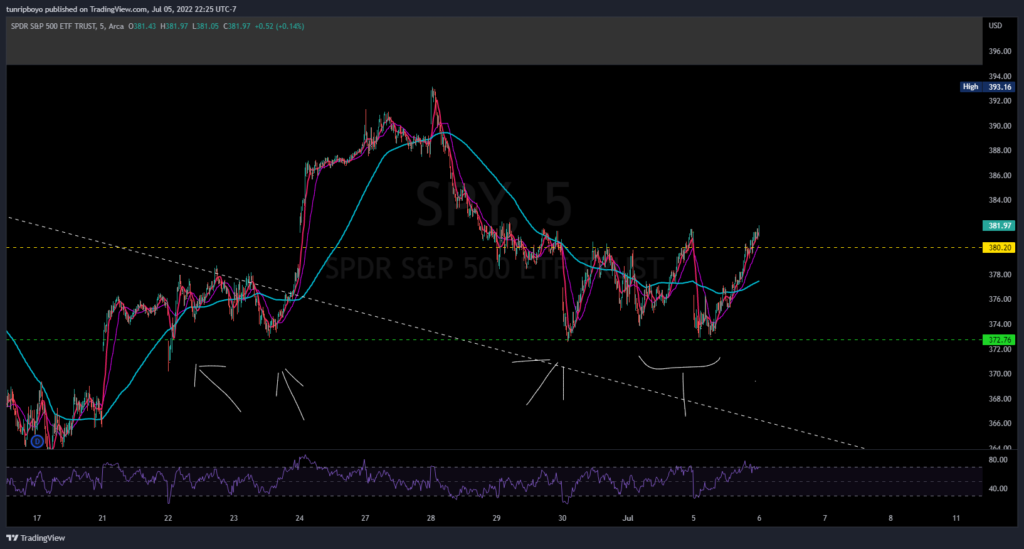
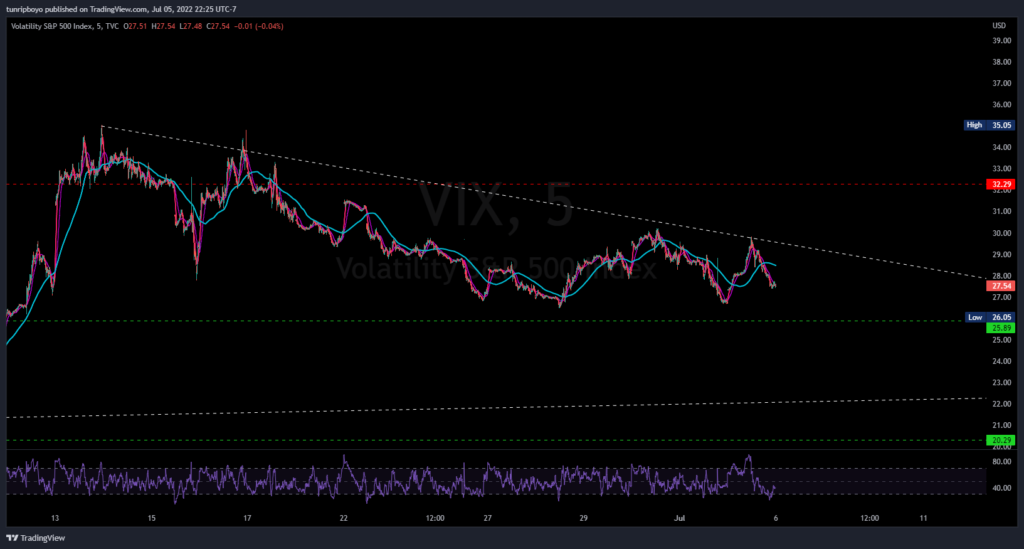
I wanted to write a whole article on this but it doesn’t seem necessary so I’ll make this shorter than usual. Today’s SPY candle would be considered an outside candle that usually indicates a trend change. Since June 30th (last week), the market dips have been scooped up rather nicely with VIX failing to make a new high and trending down (photos below). 375 support held this morning (July 5th) with the Nasdaq breadth leading the way. The open “sell” candles seemed to be a bear trap, similar to June 27ths “bull trap” where the first 5-minute candle was massive but incorrect. The SPY is now at the 380 mark with 377.98 support below it. An upside break of 385 should trigger a run to 396ish and then 401. The implied move by the end of the month is plus or minus 21 points so either 402 or 360 (a new low). While I enjoy being bearish and would love to see 320ish, the bear trade seems crowded.
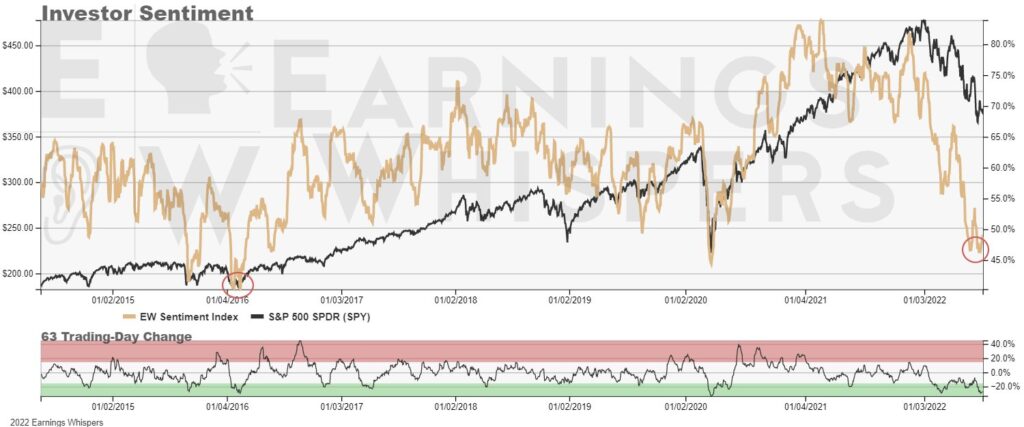
That brings us to the Nasdaq chart, which is similar to the SPY except that it has been range-bound since June 10th. As I mentioned above, the Nasdaq breadth led the way this morning, and thanks to @optionshawk, there was a surge in call buying in the tech sector with a combination of some puts being sold to open (bullish). In addition to this, the 20-year bonds have rallied a bit and usually are a good indicator for the tech sector. This comes ahead of earnings season and as always, tech will take the spotlight to set us up for the second half of 2022. Investor sentiment continues to diminish and the desire to buy the dip is drying out. EPS estimates have shrunk and the continued rise in interest rates may hurt the growth sector’s future (as it should), but as always there is hope.
There are two scenarios that will happen after the big boys report earnings. The first is obvious, they miss, bad guidance, and we continue to trend down. The second is that they miss, offer better than expected guidance with adjusted measures for rising interest rates and we remain choppy/close around 400 for the year, I’ll say 410. Whichever one pans out it doesn’t matter because I can’t predict that far ahead BUT based on some of the data I’ve looked at, the short term seems optimistic as we go into the earnings season. I mostly trade the SPY so I’ll focus my trade idea around that. With the spy sitting at 380 right now, I’m looking for the 377.98 support level to be a buying area if it holds. Some things to look for are a strong breadth ($VOLD/$VOLDQ on TOS), a weak $VIX, and commodities either falling or taking a breather like we saw today when oil fell below $100 for the session. These are some key indicators that the thesis is/should work out by the end of the month while everyone is preparing for more doom and gloom. Some other supporting evidence is AAPL running back into its resistance near 141.6 with an implied move back to 130 or 150 by the end of the month, the Nasdaq retracing about 50% of its move from the recent high/low points (295.65/275.78), and ARKK (growth stocks) recovering almost all of its losses from last week. That’s my outlook heading into earnings season and I hope it gives you a different approach than what the media is starting to shove down investors’ throats. I’d say do your own DD but you’re here because you don’t want to or haven’t been shown what to try and look for so I hope this helps. Use stops, support/resistance levels (I tweet them out all the time and they are fairly accurate), and take profit when it’s there. This is just up into ER reports and not meant for the rest of the year, I’ll try and do that later when I get more free time. Thanks for reading and make sure to check out @yuppiecapital & myself on the bluebird app.
